
Introduction
Developing enterprise applications involves more than writing business logic. Developers also need to verify that every rule executes correctly, data flows as expected, and integrations behave reliably. When an issue occurs, identifying its root cause without the right debugging tools can be difficult.
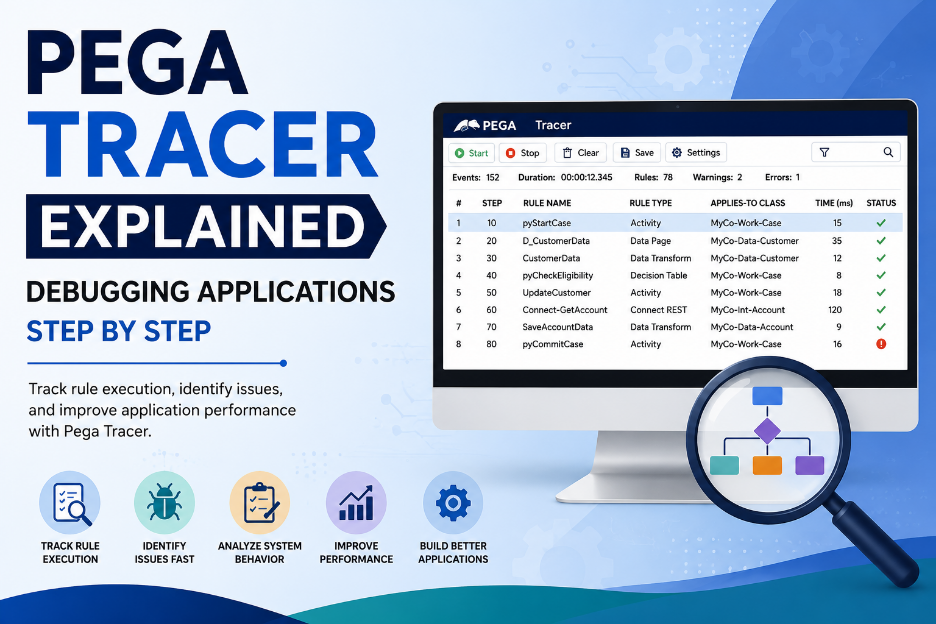
Pega Platform provides Tracer, a built-in debugging tool that records application execution in real time. It allows developers to monitor the execution of activities, data transforms, decision rules, processes, integrations, and many other runtime events. Instead of relying on application logs or assumptions, developers can observe exactly what happens during request processing.
Whether you are troubleshooting a case, testing a new feature, or analysing application performance, Tracer helps you understand how Pega processes requests and where problems occur.
What Is Pega Tracer?
Pega Tracer is a diagnostic and debugging tool available in Pega Platform that captures and displays runtime events while an application is executing.
Every action performed by a user—such as creating a case, submitting an assignment, running an activity, or calling an integration—generates a sequence of rule executions. Tracer records these events and displays them in chronological order, allowing developers to follow the application’s execution step by step.
By using Tracer, developers can identify errors, verify business logic, inspect rule execution, and troubleshoot performance issues more efficiently.
Why Use Pega Tracer?
Modern Pega applications contain numerous interconnected rules, including activities, flows, sections, decision rules, data transforms, data pages, and integrations. A single user action may trigger dozens of these rules.
Tracer provides visibility into this execution process by allowing developers to:
- Monitor rule execution in real time
- Debug application logic
- Verify data processing
- Analyse integrations
- Identify runtime exceptions
- Troubleshoot performance bottlenecks
- Validate background processing
Instead of manually reviewing multiple rules, developers can trace the entire execution path from a single interface.
What Can Pega Tracer Debug?
Tracer supports debugging for a wide variety of resources within Pega Platform, including:
- Activities
- Data Transforms
- Decision Tables
- Decision Trees
- When Rules
- Parse Rules
- Service Rules
- Connect Rules
- Flow Processing
- Queue Processing
- Background Processing
- Declarative Rules
- Data Pages
This broad coverage makes Tracer one of the most important tools available for Pega application development.
Key Features of Pega Tracer
Pega Tracer provides several powerful capabilities that simplify debugging and analysis.
Selective Tracing
Developers can choose exactly what they want to trace instead of capturing every system event.
Tracer allows filtering by:
- RuleSets
- Individual rules
- Rule types
- Event types
- Requestor sessions
This focused approach reduces unnecessary information and makes debugging easier.
Breakpoints
Tracer supports breakpoints that temporarily pause execution when a specific rule is reached.
This allows developers to inspect the application’s state before continuing execution.
Watch Variables
Developers can monitor specific properties or variables while the application executes.
This feature is particularly useful when tracking property values that change throughout processing.
Trace Reference Properties
Tracer can also monitor reference properties, helping developers understand how data changes during execution.
Remote Tracing
Developers can trace requestor sessions running on different nodes within a cluster.
This capability is especially useful when troubleshooting distributed enterprise applications.
RuleWatch Support
Tracer supports RuleWatch, enabling developers to trace services and listeners across the entire cluster.
This provides visibility into background processing that may not execute within the current requestor session.
Configuring Trace Conditions
Before starting a trace, developers can configure the events they want to capture.
Trace conditions allow filtering based on:
- Activities
- Data Transforms
- Decision Rules
- Connectors
- Services
- Processes
- Event Types
If no custom trace conditions are selected, Tracer uses its default settings.
Carefully selecting trace conditions reduces noise and makes the captured information easier to analyse.
Tracing and Capturing Events
After configuring the trace conditions, developers start the trace and perform the action they want to investigate.
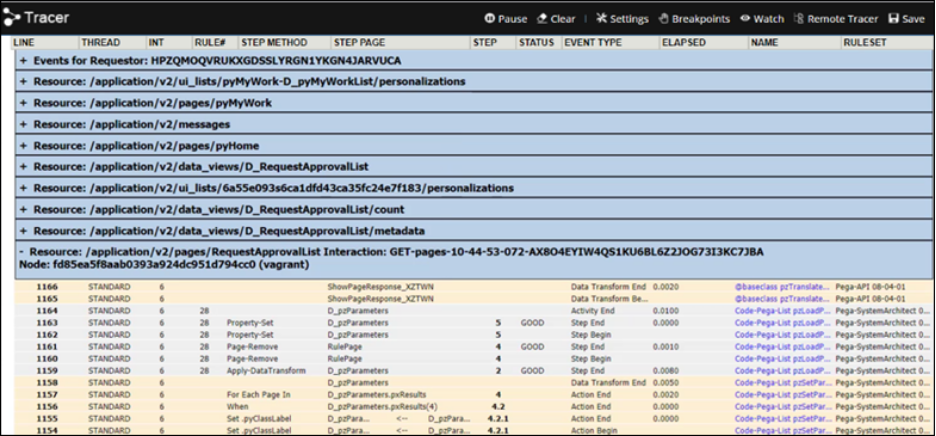
Every captured event appears as a separate row in the Tracer window.
Each event includes detailed runtime information such as:
- Rule Name
- Rule Type
- Step Number
- Event Type
- Status
- Elapsed Time
- Thread
- Requestor
- RuleSet
These details allow developers to understand exactly how the application processed the request.
Viewing Tracer Results
The Tracer window presents captured events in a structured format.
Each row represents an individual runtime event.
Developers can review:
- Rule execution sequence
- Activity steps
- Data Transform execution
- Database operations
- Integration calls
- Processing time
- Runtime exceptions
This chronological view makes it easier to identify where unexpected behaviour occurs.
Tracer results can also be saved locally as an XML file for future analysis or shared with other developers investigating the same issue.
Offline Debugging with Pega-TracerViewer
Pega also provides Pega-TracerViewer, a utility that allows developers to analyse previously saved Tracer files offline.
TracerViewer loads XML trace files and presents the information in an interactive table or tree structure.
Using TracerViewer, developers can:
- Review execution history
- Analyse rule processing
- Identify performance bottlenecks
- Investigate production issues
- Share debugging results with team members
Offline analysis is particularly useful when diagnosing complex issues that require collaboration across development teams.
Tracing Services
Services typically execute within a newly created requestor session.
Because these requestor sessions are created only when the service begins processing—and often complete within milliseconds—they can be difficult to capture manually.
Tracer provides features that allow developers to monitor service execution, making it easier to debug REST services, SOAP services, and listener-based processing.
Tracer for Constellation Applications
Pega Tracer also supports Constellation applications.
Unlike traditional applications, Constellation applications are stateless and communicate through DX APIs.
Because multiple browser requests can be active simultaneously, Tracer groups captured events by Request ID instead of displaying a single continuous execution stream.
This grouping makes it much easier to understand how individual browser requests interact with the server during a user session.
For developers building applications with Constellation, Request ID grouping provides a clearer view of runtime processing.
Best Practices for Using Tracer
To get the most value from Tracer, follow these best practices:
- Trace only the rules relevant to the issue being investigated.
- Configure trace conditions before starting the trace.
- Use filters to minimise unnecessary events.
- Combine Tracer with Clipboard and Live UI for comprehensive debugging.
- Save trace files when collaborating with other developers.
- Stop tracing immediately after reproducing the issue.
- Regularly clear old trace results before starting a new debugging session.
Following these practices improves efficiency and keeps trace output manageable.
Tracer Disk Usage
Tracer stores captured events in a trace file while debugging.
If a large number of events are recorded, the file size can grow significantly.
To prevent excessive disk usage, Pega automatically limits the size of trace files. This ensures that tracing has minimal impact on system performance while still providing sufficient information for debugging.
Common Use Cases
Pega Tracer is commonly used to:
- Debug activities and data transforms
- Validate decision rules
- Monitor queue processing
- Troubleshoot REST and SOAP integrations
- Analyse service execution
- Investigate background processing
- Verify flow execution
- Measure rule execution time
- Identify application performance issues
These capabilities make Tracer an essential tool throughout the development and testing lifecycle.
Final Thoughts
Pega Tracer is one of the most powerful debugging tools available in the Pega Platform. By capturing rule execution, runtime events, integrations, and system processing in real time, it provides developers with complete visibility into application behaviour.
Whether you’re troubleshooting a failed activity, analysing a background queue processor, debugging a REST service, or testing a Constellation application, Tracer simplifies the process by showing exactly what happens behind the scenes. Features such as selective tracing, breakpoints, watch variables, RuleWatch support, offline analysis with Pega-TracerViewer, and Request ID grouping for Constellation applications make it an indispensable tool for every Pega developer.
Mastering Pega Tracer not only helps resolve issues faster but also improves application quality, reduces debugging time, and enables developers to build more reliable and high-performing enterprise applications.
