In today’s fast-paced digital environment, making data-driven decisions is more critical than ever. Pega Platform™ equips organizations with sophisticated tools to retrieve, analyze, and present application data in powerful ways. Through comprehensive Insights and traditional Reporting features, businesses can uncover trends, monitor performance, and identify opportunities for growth. This in-depth guide explores how Pega’s data visualization and reporting features help businesses transform raw data into actionable intelligence.
Transforming Data into Actionable Insights: An Overview
Pega Platform™ offers a diverse set of features that turn complex data into intuitive, visually appealing, and actionable insights. Whether you’re analyzing sales performance, customer behavior, operational trends, or team productivity, Pega’s Insights and Reports provide dynamic ways to visualize and communicate critical business information. These tools help companies make informed decisions by presenting data clearly and effectively.
Key Features of Pega Platform™ Reporting and Insights:
- Customizable, Interactive Insights
- Traditional Reports with Detailed Data Views
- Seamless Integration with OLAP Databases
- Powerful Data Extraction with BIX
- Real-Time Data Insights Powered by Generative AI
1. Insights: Interactive, Dynamic, and Tailored Visualizations
Insights are designed to empower users to explore and analyze their data in an interactive, visually intuitive format. With Pega Platform™’s Insights, users can easily generate charts, tables, and graphs to represent application data, offering a deeper understanding of trends, performance, and opportunities.
Why Insights Matter:
Insights allow for dynamic exploration—enabling businesses to drill down into specific data points, apply filters, and even manipulate the presentation to reflect specific business needs. For example, within a sales application, users can create a visualization that tracks monthly sales performance across different regions, identifying high-performing territories and areas requiring additional focus.
Key Advantages of Pega Insights:
- Interactive Data Exploration: Customize visualizations and drill deeper into specific data points.
- Real-Time Updates: Generate AI-powered insights at runtime using Pega GenAI™ for up-to-the-minute data.
- Shareable Dashboards: Easily share tailored insights with different stakeholders or embed them in landing pages for broader visibility.
- Dynamic Charts and Graphs: Choose from various chart types, including bar, line, pie, and scatter plots, to represent data in an easy-to-understand way.
Example Use Case:
Imagine you are analyzing product performance in a retail business. Using Pega Insights, you can quickly identify which products are performing well in terms of sales, highlight low-performing items in red for easy identification, and compare these results to your target sales levels represented by a reference line. This allows stakeholders to visualize both successes and areas requiring action at a glance.
Pega GenAI™: Data Analysis Reinvented
Pega Platform™ leverages Pega GenAI™ to help automate and enhance data analysis. With generative AI, you can automatically generate complex queries to retrieve insights that would typically require manual intervention. For instance, you can instantly generate a report of the average sales across different regions or retrieve the top 5 best-selling products with just a few clicks.
2. Traditional Reports: Comprehensive, Structured, and Precise
Types of Reports in Pega Platform™:
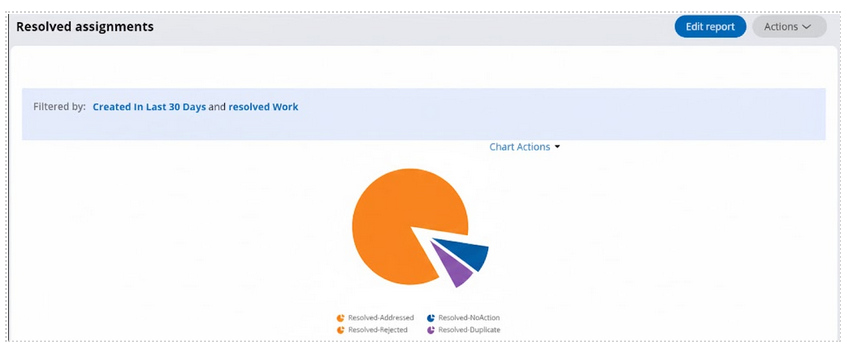
- List Reports: Present detailed data in columns, ideal for thorough data review and trend analysis.
- Summarized Reports: Offer aggregate data and statistics, enhanced with static charts to help users visualize key metrics.
Customization and Flexibility:
Traditional reports in Pega are fully customizable to suit the specific needs of your business. You can sort, filter, and group data based on different criteria. For example, a retail order report could be filtered by product category, then sorted by sales volume to analyze which products are in demand.
Example Use Case:
In a financial reporting scenario, you could generate a detailed quarterly profit-and-loss statement for the business. Using Pega’s traditional reporting features, you can break down financial data by region, product line, or department, and apply filters to focus on key areas such as cost-saving opportunities or high-revenue segments.
Limitations of Traditional Reports:
While traditional reports provide detailed data, the charts are static—meaning that unlike Insights, they do not support drilling down into subsequent levels of data. This makes them more suitable for overview-level reporting rather than deep data exploration.
3. External OLAP Databases: Optimizing Reporting with High-Performance Analytics
Online Analytical Processing (OLAP) databases such as Amazon Redshift and Google BigQuery offer powerful support for business intelligence applications. By integrating these high-performance databases with Pega Platform™, businesses can significantly improve the efficiency of their reporting and insights generation, particularly when working with large datasets.
Why Integrate OLAP Databases?
OLAP databases are optimized for analytical workloads, offering faster query performance and better scalability compared to traditional databases. By offloading data-intensive queries to an OLAP database, businesses can enhance the speed of reporting and gain real-time insights into high-volume data.
Benefits of Using OLAP Databases with Pega:
- Increased Performance: Offload heavy analytical workloads to external databases.
- Real-Time Reporting: Generate reports and insights with minimal delay.
- Flexible Data Structures: Customize the schema to match specific reporting needs.
- Improved System Performance: OLAP databases are designed to handle complex queries, minimizing the load on the primary transactional system.
4. Data Extraction with BIX: Enabling Seamless Data Integration
Pega’s Business Intelligence Exchange (BIX) is a comprehensive tool for extracting data from Pega Platform™ and integrating it with other systems. By using BIX, businesses can export data in multiple formats such as XML, CSV, and database schemas, and load it into external systems for advanced analytics.
What Makes BIX Powerful?
BIX functions as an ETL (Extract, Transform, Load) tool, enabling businesses to extract transactional data from Pega applications and feed it into business intelligence tools, data warehouses, or other external systems. This capability is essential for organizations looking to create a holistic view of their data across multiple platforms.
Key Features of BIX:
- Batch Data Extraction: Extract data in large volumes, supporting both full and incremental extracts.
- Real-Time Data Integration: Enable near real-time data extraction for dynamic reporting.
- Customization: Tailor the extraction process to meet specific business needs.
Example Use Case:
For a manufacturing company, BIX can be used to extract production line data and integrate it with a data warehouse. This allows the company to analyze production trends, monitor operational efficiency, and identify bottlenecks for continuous improvement.
5. Real-Time Insights Powered by Generative AI
In addition to traditional reporting and OLAP database integrations, Pega Platform™ uses Generative AI to deliver real-time insights. This feature revolutionizes data analysis by allowing the platform to autonomously generate insights based on user prompts, eliminating the need for complex queries or manual data manipulation.
How Real-Time Insights Work:
Through Pega GenAI™, users can generate insights on the fly. Whether you need a quick analysis of sales performance across various regions or want to identify top-selling products based on real-time data, the platform can instantly pull relevant data and generate reports within moments.
Seamless Data Analysis: A Unified Reporting Ecosystem
Pega Platform™ integrates Insights, Traditional Reports, and BIX into a unified reporting ecosystem that supports data analysis across the organization. From real-time insights generated by Pega GenAI™ to structured reports and external data integrations, Pega provides a complete solution for businesses looking to maximize the value of their data.
Benefits of Pega’s Reporting Ecosystem:
- Comprehensive Data View: Combine application data with external systems for a holistic view.
- Scalability: Leverage OLAP databases to manage large datasets and generate complex reports.
- Ease of Use: Whether through simple drag-and-drop visualizations or custom report generation, Pega’s tools are designed for ease of use, empowering business users without needing deep technical expertise.
Driving Business Success with Pega Platform™ Reporting Tools
In a data-driven world, the ability to turn information into insights is paramount. Pega Platform™’s Insights and Reporting capabilities provide businesses with everything they need to explore, analyze, and act on their data. With dynamic, interactive visualizations, powerful OLAP integrations, real-time data updates powered by AI, and seamless data extraction through BIX, Pega gives businesses the tools they need to succeed.
–TEAM ENIGMA
