
Introduction
In enterprise applications, user experience depends heavily on fast, stable, and responsive user interfaces. When UI issues occur, developers must quickly identify whether the problem originates from the browser, client scripts, AJAX communication, or server interactions.
Advanced Client-Side Debugging in Pega helps developers analyze browser-side behavior, troubleshoot dynamic UI issues, monitor network calls, and optimize application performance.
Client-side debugging enables organizations to deliver reliable, high-performing, and seamless digital experiences.
What is Client-Side Debugging?
Client-side debugging is the process of identifying and resolving issues occurring within the browser layer of a Pega application.
It focuses on:
- UI rendering behavior
- Dynamic section refreshes
- JavaScript execution
- AJAX communication
- Clipboard synchronization
- Data page loading
- Browser performance
- Constellation UI rendering
Client-side debugging helps developers understand how the browser interacts with Pega rules and server responses.
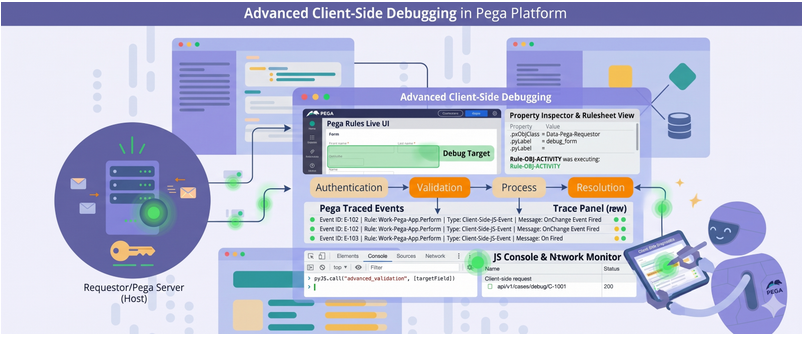
End-to-End Client-Side Debugging Flow
1. Issue Identification
A UI issue is identified during user interaction, such as missing sections, refresh failures, slow loading, or incorrect data display.
2. Browser Inspection
Browser developer tools are used to inspect HTML, CSS, JavaScript, and DOM structures.
3. Network Monitoring
AJAX requests and API responses are analyzed to verify communication between browser and server.
4. Clipboard Validation
Clipboard data is inspected to confirm whether property values are updated correctly.
5. Rule Inspection
Live UI and Tracer are used to identify the rules, sections, harnesses, and activities involved.
6. Refresh Logic Verification
Dynamic layouts, visibility conditions, and refresh configurations are validated.
7. JavaScript Analysis
Client-side scripts and browser console errors are analyzed.
8. Performance Investigation
Rendering delays, excessive refreshes, and heavy UI components are examined.
9. Root Cause Resolution
The issue is corrected through rule updates, configuration fixes, or optimized UI design.
Real-Time Example
A customer updates a field in a Pega form, but dependent fields do not refresh dynamically.
The developer analyzes the issue using browser developer tools, validates AJAX requests in the Network tab, checks clipboard values, and inspects refresh configurations through Live UI.
The investigation identifies a missing refresh configuration, which is corrected to restore proper dynamic behavior.
Key Components
- Browser Developer Tools
- Live UI
- Clipboard
- Tracer
- AJAX Communication
- Dynamic Layouts
- Data Pages
- JavaScript Execution
- Network Monitoring
- Constellation UI APIs
Common Client-Side Issues
UI Rendering Issues
- Blank screens
- Hidden sections
- Missing fields
- Layout failures
Refresh Issues
- Section refresh failures
- Dynamic visibility problems
- Delayed UI updates
JavaScript Issues
- Script execution errors
- Browser console exceptions
- Event trigger failures
Data Synchronization Issues
- Clipboard mismatch
- Stale UI data
- Incorrect property display
Performance Issues
- Slow harness loading
- Excessive DOM rendering
- Multiple network calls
Important Debugging Tools
Browser DevTools
Used for:
- DOM inspection
- CSS validation
- JavaScript debugging
- Network monitoring
Live UI
Used to inspect:
- Sections
- Harnesses
- Visibility conditions
- Dynamic layouts
Clipboard
Used to verify:
- Property values
- Page data
- Data synchronization
Tracer
Used to analyze:
- Activities
- Data Transforms
- Declarative rules
- UI events
Debugging Constellation UI
In Constellation architecture:
- UI is React-based
- Communication occurs through DX APIs
- Rendering is metadata-driven
Debugging focuses on:
- API responses
- JSON payload validation
- Field mapping analysis
- Network request monitoring
Best Practices
- Use modular sections and layouts
- Minimize unnecessary refresh operations
- Avoid excessive custom JavaScript
- Monitor browser console regularly
- Use Live UI frequently during development
- Validate clipboard data during debugging
- Optimize large data pages
- Monitor application performance continuously
Enterprise-Level Debugging Tips
- Perform debugging primarily in lower environments
- Capture HAR files for network analysis
- Use Tracer carefully in high-volume systems
- Monitor client-side exceptions proactively
- Optimize refresh strategies for better performance
- Use Pega monitoring tools for diagnostics
Conclusion
Advanced Client-Side Debugging in Pega enables developers to troubleshoot complex browser-side issues effectively.
By combining browser tools, network analysis, clipboard validation, Live UI inspection, and tracing capabilities, organizations can build stable, responsive, and high-performing applications.
Understanding the complete debugging lifecycle helps enterprises improve application reliability, user experience, and operational efficiency.
