
Introduction
Modern enterprise applications frequently require background processing for tasks that should not block user interactions. Sending emails, generating reports, calling external APIs, updating audit logs, processing batch jobs, and handling asynchronous business logic are common examples.
If such tasks execute synchronously, users experience delays, poor responsiveness, and performance bottlenecks.
Pega solves this through asynchronous processing mechanisms such as Queue Processors.
Queue Processors allow work to be placed into background execution queues where the system processes it independently without delaying the primary user flow.
However, when queue processing fails, the effects can be severe. Emails may not be sent. Background integrations may stop. SLA escalations may fail. Audit records may remain incomplete. Business workflows may become stuck waiting for asynchronous completion.
Because queue processing happens outside direct user interaction, debugging these failures requires a different approach.
This article explains Queue Processor architecture, common failure scenarios, and practical troubleshooting techniques.
Understanding Queue Processors
A Queue Processor is Pega’s modern asynchronous background processing mechanism used to execute queued tasks independently of user request processing.
Instead of executing business logic immediately, work is placed into a queue.
Example:
User submits case
↓
Queue item created
↓
User continues immediately
↓
Background processor executes task
This improves responsiveness and scalability.
Common use cases:
- email sending
- audit logging
- integration callbacks
- report generation
- SLA escalation support
- asynchronous validations
- batch processing
How Queue Processing Works Internally
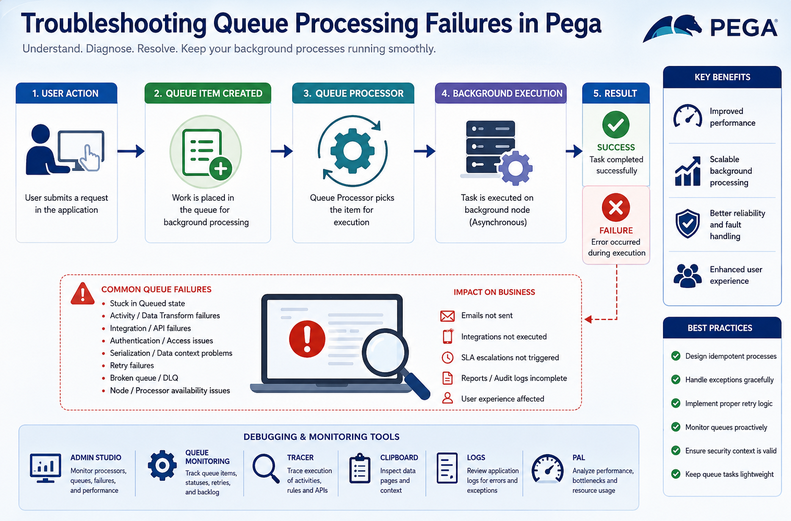
Internal flow:
Business Event
↓
Queue Item Created
↓
Stored in Queue Table
↓
Queue Processor Picks Item
↓
Background Execution
↓
Success / Retry / Failure
Execution components include:
- queue processor rule
- background node
- processing thread
- activity / data transform execution
- retry management
- failure handling
Sync vs Async Processing
Synchronous Processing
Execution happens immediately.
Example:
Submit form
↓
API call executes
↓
Wait for response
↓
User proceeds
Problem:
slow user experience.
Asynchronous Processing
Execution happens later.
Example:
Submit form
↓
Queue item created
↓
User proceeds
↓
Background execution later
Advantage:
faster UI responsiveness.
Queue Item Lifecycle
A queue item typically moves through states:
Queued
↓
Picked for Processing
↓
Executing
↓
Success
Failure path:
Queued
↓
Execution Failure
↓
Retry
↓
Repeated Failure
↓
Broken Queue / Dead Letter
Understanding this lifecycle helps troubleshooting.
Common Queue Processing Problems
Queue Item Stuck in Queued State
Problem:
Item remains:
Queued
forever.
Possible causes:
- processor disabled
- no active background node
- node classification issue
- queue processor stopped
- system resource constraints
Activity Failure During Processing
Problem:
Queue item picked.
Execution fails.
Possible causes:
- activity exception
- null property reference
- bad clipboard context
- invalid page structure
- missing parameters
Integration Failure
Problem:
Queue processor invokes API.
API fails.
Examples:
- timeout
- authentication failure
- invalid response
- endpoint unavailable
Queue item fails.
Authentication / Access Issues
Background execution runs with access context.
If incorrect:
processing fails.
Examples:
- missing access group
- insufficient privileges
- operator mismatch
Serialization / Data Context Problems
Queue items may depend on context data.
Problem:
required data unavailable during background execution.
Example:
Foreground clipboard:
CustomerPage
Background processor:
page absent.
Cause:
context not serialized correctly.
Retry Failures
Problem:
Queue retries repeatedly.
Never succeeds.
Possible causes:
- permanent logic defect
- invalid data
- external dependency failure
- repeated authentication failure
Dead Letter / Broken Queue Problems
Repeated failures eventually move items into failure handling states.
Problem:
work silently stops.
Node Processing Failures
Problem:
queue processor configured correctly.
Node unavailable.
No execution.
Examples:
- background node down
- cluster issue
- node classification mismatch
SLA / Background Dependency Failures
If SLA processing depends on background execution:
business escalation may fail.
Example:
Approval escalation never occurs.
Debugging Tools
Admin Studio
Primary monitoring tool.
Check:
- queue processor health
- active processors
- failed items
- retry counts
- backlog volume
Critical first stop.
Queue Processor Monitoring
Inspect:
- queued items
- processing state
- broken items
- execution metrics
Tracer
Useful when logic execution fails.
Trace:
- activities
- data transforms
- integrations
- exceptions
Clipboard Viewer
Useful for activity failures.
Check:
- runtime page context
- parameter availability
- property state
Logs
Critical for background failures.
Check:
- exception stack traces
- authentication failures
- integration errors
- processor crashes
Examples:
- PegaRULES log
- node logs
PAL
Useful for performance bottlenecks.
Detect:
- processor overload
- slow execution
- repeated retries
Step-by-Step Troubleshooting Approach
Step 1: Identify Queue State
Question:
Is item:
- queued?
- executing?
- failed?
- retrying?
- broken?
State determines direction.
Step 2: Check Admin Studio
Verify:
- processor enabled
- node active
- failure counts
- backlog size
Step 3: Inspect Logs
Find exact failure.
Never guess.
Logs reveal truth.
Step 4: Validate Processing Logic
Check:
- activity steps
- property references
- parameters
- exception handling
Step 5: Verify Integration Dependencies
If API involved:
check:
- endpoint availability
- authentication
- payload correctness
- timeout handling
Step 6: Check Security Context
Verify:
- access group
- privileges
- operator permissions
Step 7: Validate Data Context
Confirm required data exists.
Background execution may lack foreground clipboard pages.
Step 8: Check Node Availability
Verify:
- background node health
- cluster availability
- queue processor execution eligibility
Real Production Scenario 1
Problem:
Customer notification emails not sent.
Admin Studio:
items queued.
Processor inactive.
Cause:
background node unavailable.
Fix:
restore node.
Real Production Scenario 2
Problem:
Audit logging queue repeatedly failing.
Logs:
null pointer exception.
Cause:
missing clipboard property.
Fix:
defensive null handling.
Real Production Scenario 3
Problem:
External API callback processing fails.
Logs:
401 Unauthorized.
Cause:
expired credentials.
Fix:
update authentication configuration.
Best Practices
- keep queue logic lightweight
- avoid excessive dependency on clipboard context
- validate inputs defensively
- implement strong exception handling
- monitor queue health proactively
- use retry logic appropriately
- avoid infinite retry patterns
- secure background execution properly
- isolate integration failures gracefully
- keep async design resilient
Common Mistakes
- assuming queue processor runs immediately
- ignoring Admin Studio monitoring
- depending on foreground clipboard state
- weak exception handling
- missing authentication setup
- retrying permanent failures endlessly
- poor background node configuration
- overloading queue processors with heavy work
Queue Processor vs Agent
Queue Processors:
- modern architecture
- scalable
- preferred approach
- better monitoring
- improved fault handling
Agents:
- legacy background mechanism
- older architecture
- still interview relevant
Preferred:
Queue Processors.
Conclusion
Queue Processors are essential for scalable asynchronous execution in enterprise Pega applications. However, because background failures occur outside direct user interaction, troubleshooting requires visibility into processor health, execution context, logs, integrations, and node infrastructure.
By understanding queue lifecycle behavior and using systematic debugging techniques, developers can quickly diagnose and resolve even complex asynchronous processing failures.
