
Introduction
Performance problems in Pega applications do not always come from slow database queries or poor integrations. Sometimes, the problem is much closer to the runtime.
One common cause is excessive data stored on the Clipboard.
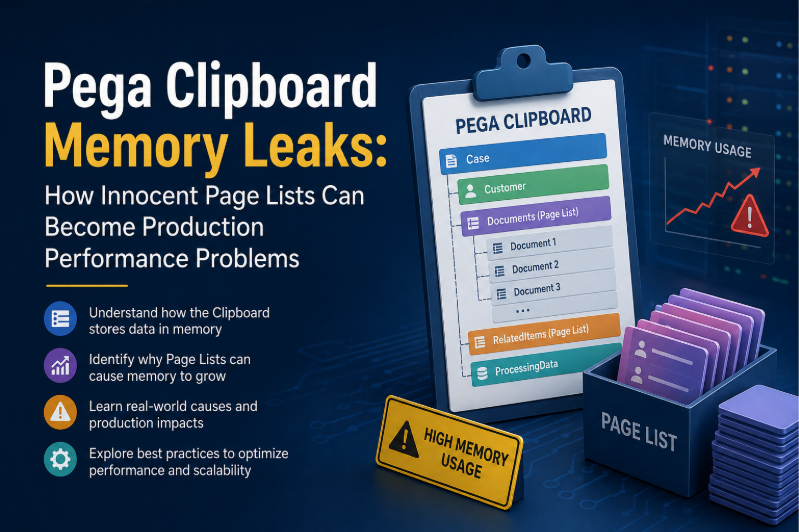
The Pega Clipboard acts as runtime working memory during case processing. It can hold case data, embedded pages, Page Lists, Page Groups, Data Page content, integration responses, parameters, and temporary data.
The Clipboard itself does not cause performance problems. Instead, issues can occur when an application stores too much data for too long.
A Page List is a good example.
A Page List with a few records is usually fine. However, storing thousands or millions of complex pages can quickly increase memory use. As a result, processing can slow down and garbage collection can increase.
In severe cases, excessive Clipboard growth can affect requestor or JVM stability.
This article explains how Page Lists can create production performance problems. It also covers common causes, troubleshooting steps, and practical design rules for high-volume Pega applications.
1. Understanding the Pega Clipboard
The Pega Clipboard works as the runtime working memory for application processing.
A typical case can contain structures such as:
Case
│
├── Customer Information
├── Address
├── Contact Details
├── Documents()
├── RelatedItems()
└── ProcessingData
The Clipboard can also contain temporary pages and data retrieved during processing.
For example, an integration may return customer information. The application may then copy that information into a temporary structure for validation.
These objects use runtime memory while the requestor retains them.
Therefore, developers should consider two key factors:
Data size × Data lifetime
A small object that exists for a short time usually has little impact.
In contrast, a large object that remains in memory during a long-running operation can become expensive.
This difference becomes especially important in high-volume processing.
2. Why Page Lists Can Become a Performance Problem
Page Lists are useful for storing collections of related objects.
For example:
Customer
   |
   └── Addresses()
        ├── Address 1
        ├── Address 2
        └── Address 3
This design is normal.
However, problems can arise when a Page List becomes a container for an entire dataset.
Consider a file-processing application with 500,000 records:
Input File
    ↓
Read Records
    ↓
Create Page List
    ↓
Store 500,000 Records
    ↓
Process Records
The design may work well with a small test file. However, production data can create a much larger runtime structure.
The situation becomes more serious when every Page List item contains:
- Many properties
- Embedded Pages
- Nested Page Lists
- API response data
- Document metadata
- Large strings
- Duplicate information
Therefore, record count alone does not determine memory use.
The complexity of each page also matters.
3. The Hidden Impact of Nested Structures
Nested collections can make a Page List much more expensive.
For example:
Customers()
│
├── Customer 1
│     └── Orders()
│          ├── Order 1
│          ├── Order 2
│          └── Order 3
│
├── Customer 2
│     └── Orders()
│          ├── Order 1
│          ├── Order 2
│          └── Order 3
│
└── Customer 3
      └── Orders()
           ├── Order 1
           ├── Order 2
           └── Order 3
Now imagine thousands of customer pages. Each customer may contain several order pages.
As a result, the number of Clipboard objects can grow quickly.
Therefore, developers should ask more than:
“How many records am I loading?”
A better question is:
“How complex is each record, and how many records remain in memory?”
This approach gives a clearer view of the real memory requirement.
4. Clipboard Growth Is Not Always a Traditional Memory Leak
The term “memory leak” can describe several types of memory problems.
A traditional memory leak occurs when an application keeps memory that it no longer needs. The application cannot reclaim that memory because unwanted references still exist.
Pega applications can experience a different problem: uncontrolled data retention.
Consider this flow:
Start Processing
      ↓
Create Temporary Page
      ↓
Add to Page List
      ↓
Process Next Record
      ↓
Create Another Page
      ↓
Add to Page List
      ↓
Continue...
The Page List continues to grow because each processed page remains referenced.
The application is doing what the design tells it to do. However, the design keeps data that the process no longer needs.
That creates an architectural problem:
The application retains information beyond its useful lifetime.
Increasing JVM heap size may delay the failure. However, it does not remove the underlying cause.
5. Common Causes of Excessive Clipboard Usage
5.1 Loading More Data Than Required
One common design problem is retrieving more data than the process needs.
For example:
Database
   ↓
100,000 Records
   ↓
Clipboard
   ↓
Application Needs 500 Records
If the application can filter the data before it reaches the Clipboard, that approach is usually more efficient.
Instead of:
Load Everything → Filter in Memory
prefer:
Filter at Source → Load Required Data → Process
This reduces the working set.
It also reduces unnecessary data transfer.
5.2 Continuously Growing Page Lists
Another problem occurs when an application adds every processed record to a Page List.
For example:
For each record:
    Process record
    Add record to ProcessedRecords()
If the application never uses the final Page List, the stored records provide little value.
A better design is:
Read Record
    ↓
Process
    ↓
Persist Result
    ↓
Move to Next Record
The application should retain only the information needed for the current task.
5.3 Copying Complete Pages
Copying complete pages can also increase memory use.
Suppose an API returns:
CustomerResponse
├── CustomerID
├── Name
├── Contact
├── Accounts()
├── Transactions()
├── Documents()
├── Preferences()
└── History()
However, the application only needs:
CustomerID
Name
Contact
Copying the complete response creates unnecessary duplication.
Instead, create a smaller structure that contains only the required properties.
This practice is especially useful in integration-heavy and batch-processing applications.
6. Data Pages and Integration Responses
Data Pages provide convenient access to reusable data. However, developers should still consider data size and lifetime.
A potentially inefficient flow can look like this:
Large Data Source
       ↓
Load Large Dataset
       ↓
Copy Entire Result
       ↓
Store in Page List
       ↓
Repeat
Data Pages are not automatically inefficient.
The key concern is how the application consumes the returned data.
Before copying or retaining Data Page content, ask:
- Do I need the complete result?
- Can the source return fewer records?
- Can I retrieve only the required properties?
- Is the Data Page scoped correctly?
- Is the application copying the same data more than once?
- Can the process work with smaller batches?
The same principle applies to REST and other integration responses.
For example, an external service may return a large payload while the application needs only a few fields.
Keeping the entire response throughout a long-running process can increase the Clipboard working set.
Therefore, process only the data that the application actually needs.
7. Why the Problem Often Appears Only in Production
Clipboard problems can remain hidden during development.
A developer may test an application with:
100 Records
The application may perform well.
Production, however, may process:
100,000 Records
or even millions of records.
The same logic now has a very different resource requirement.
A useful architectural model is:
Working Set ≈ Number of Retained Objects × Object Complexity
This is not an exact JVM memory formula.
Instead, it provides a simple way to think about Clipboard growth.
If the number of retained objects keeps increasing, memory pressure can increase as well.
Typical symptoms include:
- Processing becomes slower over time
- Requestor response time increases
- Garbage collection becomes more frequent
- Large Clipboard structures appear during troubleshooting
- Long-running operations become unstable
- Application responsiveness decreases
- High-volume jobs fail intermittently
One useful warning sign is a gradual slowdown.
For example, the first part of a process may run quickly. Later, each batch may take longer.
When that happens, investigate data accumulation and working-set growth.
8. How to Troubleshoot Clipboard Growth
A structured investigation works better than simply increasing memory allocation.
Step 1: Identify the Processing Path
First, determine where the problem occurs.
Possible areas include:
- Case creation
- Case processing
- Data loading
- File processing
- Integration processing
- Batch jobs
- Queue-based processing
- UI operations
Knowing the processing path helps narrow the investigation.
Step 2: Inspect Clipboard Structures
Next, look for unusually large structures.
Pay attention to:
- Large Page Lists
- Large Page Groups
- Deeply nested pages
- Duplicate structures
- Large API responses
- Temporary pages
- Unexpected data objects
- Collections that keep growing
Then ask:
“Why is this data still present?”
If the reason is unclear, investigate the structure further.
Step 3: Trace Where the Data Is Created
Review the rules involved in the processing path.
These may include:
- Data Transforms
- Activities
- Functions
- Data Pages
- Connectors
- Loops
- Report Definitions
- Asynchronous processing logic
Look for repeated page creation and unnecessary copying.
Step 4: Correlate Performance Monitoring
PDC and other platform monitoring capabilities can help identify performance patterns.
However, an alert does not automatically identify the root cause.
Instead, compare the findings with:
- Processing volume
- Clipboard growth
- Database activity
- Integration latency
- Requestor behavior
- JVM memory behavior
- Garbage collection
- Application server metrics
The goal is to connect the application operation with the observed performance impact.
9. A Production Example
Consider a customer migration process that receives a large file.
An inefficient design may look like this:
Large File
    ↓
Load All Records
    ↓
Create Customers()
    ↓
Store Entire Dataset
    ↓
Validate
    ↓
Call External API
    ↓
Update Records
    ↓
Generate Output
In this design, one requestor handles a very large working set.
As processing continues, the working set may grow:
More Records
     ↓
Larger Page List
     ↓
More Memory Retained
     ↓
Increased Memory Pressure
     ↓
More GC Activity
     ↓
Longer Processing Time
A better design divides the workload into controlled units:
Large File
    ↓
Read Batch
    ↓
Validate
    ↓
Process
    ↓
Persist Results
    ↓
Handle Errors
    ↓
Next Batch
The right batch size should come from performance testing and workload characteristics.
Avoid choosing an arbitrary number.
The goal is simple:
Keep the active working set under control.
10. When Asynchronous Processing Makes Sense
Long-running, high-volume operations do not always need to depend on one synchronous requestor.
For suitable workloads, asynchronous processing can provide a more scalable design.
For example:
Input
  ↓
Queue
  ↓
Worker
  ↓
Process Record / Batch
  ↓
Persist Result
  ↓
Next Work Item
This approach can provide several benefits:
- Smaller working sets
- Better workload distribution
- Fault isolation
- Controlled retries
- Improved scalability
- Less dependence on one requestor
Pega provides multiple options for asynchronous processing.
The right option depends on factors such as workload size, transaction boundaries, retry needs, and application architecture.
Therefore, the key principle is not simply:
“Use asynchronous processing.”
Instead:
“Choose a processing model that matches the volume and lifetime of the work.”
11. Five Practical Design Rules
1. Load Only What You Need
Reduce the dataset as early as practical.
Avoid retrieving everything and filtering it later.
2. Avoid Unnecessary Page Copies
If the application needs only a few properties, do not duplicate an entire complex page.
3. Control Page List Growth
Do not continuously append records unless the complete collection is genuinely required.
4. Keep Temporary Data Temporary
Temporary structures should have a clear purpose.
Remove unnecessary data from the active working set when the process no longer needs it.
5. Design for Production Volume
Test with realistic:
- Record counts
- Payload sizes
- Concurrency
- Processing duration
A design that works with 100 records may not work with one million records.
12. Clipboard Anti-Patterns
The following patterns deserve attention during code reviews.
Anti-Pattern 1: “Store Everything in a Page List”
This can work for small collections.
However, it becomes risky when the collection represents a high-volume dataset.
Anti-Pattern 2: “Copy the Entire API Response”
This may seem convenient during development.
However, copying a large response is wasteful when the application needs only a few fields.
Anti-Pattern 3: “Increase the Heap”
More memory can postpone failure.
However, it does not fix inefficient data retention.
Anti-Pattern 4: “Process Everything in One Request”
Large, long-running operations can create unnecessarily large working sets.
Breaking the work into smaller units can provide better control.
Anti-Pattern 5: “It Worked in Development”
Small datasets can hide scalability problems.
Therefore, production-like testing remains important.
13. Production Readiness Checklist
Before deploying a high-volume Pega process, review these questions:
- Is the Clipboard working set reasonable?
- Are large Page Lists genuinely required?
- Are nested Page Lists necessary?
- Are complete API responses being retained?
- Are unnecessary properties being copied?
- Can filtering happen before data reaches the Clipboard?
- Can the workload run in batches?
- Is asynchronous processing appropriate?
- Are temporary structures retained longer than needed?
- Has the application been tested with realistic production volumes?
- Have performance metrics been reviewed during load testing?
- Have PDC findings been compared with actual application behavior?
These checks should become part of the design and code-review process for high-volume applications.
Conclusion
Pega Clipboard performance problems rarely start with an obviously incorrect design.
Instead, they can begin with small decisions.
For example:
“Let’s temporarily store this record.”
“Let’s copy this response.”
“Let’s add this item to the Page List.”
“We might need this data later.”
Each decision may appear harmless.
However, repeating the same decisions thousands of times can create a large working set.
The lesson is not to avoid Page Lists or Clipboard structures. They remain important parts of Pega application development.
The real goal is to control what the application stores, how much it stores, and how long it keeps that data.
A scalable Pega application should keep its runtime working set focused on the current unit of work.
Large datasets should be filtered early when possible. They can also be processed in manageable batches or handled through suitable asynchronous and persistence mechanisms.
Ultimately, one question should guide Clipboard design:
“Does the application really need to keep this data in memory right now?”
If the answer is no, removing that data from the active working set can help protect application performance and scalability.
