
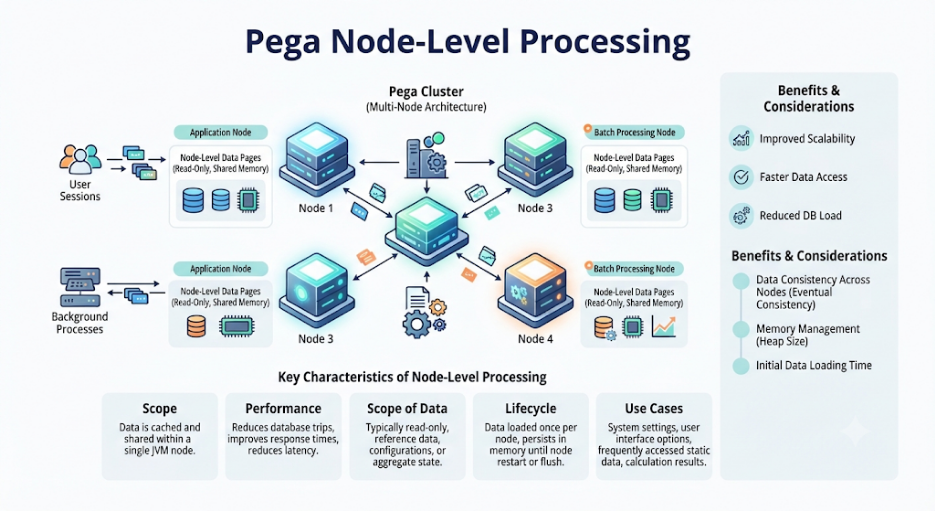
Pega applications are commonly deployed in distributed environments where multiple application server nodes work together to handle user requests, background jobs, integrations, and system processing.
In such environments, understanding node-level processing in Pega is important for application architecture, performance troubleshooting, high availability, background processing, and production support.
A Pega node is more than simply another application-server instance. Depending on its configuration and responsibilities, a node can participate in request processing, asynchronous work, scheduled processing, queue processing, caching, integrations, and other runtime activities.
This article explains how Pega processes work at the node level and how multiple nodes cooperate within a Pega cluster.
What Is a Pega Node?
A Pega node is an instance of the Pega application runtime running on an application server.
A typical production environment may contain multiple nodes:
Load Balancer
|
+————–+————–+
| | |
v v v
Node 1 Node 2 Node 3
| | |
+————–+————–+
|
Database
Each node has its own runtime process and memory space.
However, the nodes generally operate against shared application data and configuration stored in the Pega database and other shared infrastructure.
This architecture allows Pega applications to scale horizontally.
Why Multiple Nodes Are Used
A single node can process application traffic, but enterprise applications commonly require multiple nodes for:
- High availability
- Horizontal scalability
- Load distribution
- Fault tolerance
- Background processing
- Integration processing
- Maintenance without complete application downtime
For example, if one node becomes unavailable, a load balancer can route new user requests to other available nodes.
User Request
|
v
Load Balancer
/ | \
/ | \
v v v
N1 N2 N3
Node-Level Processing vs. Application-Level Processing
It is important to distinguish between the application and the node.
The application defines business functionality, rules, case types, workflows, and configuration.
The node provides a runtime environment where that functionality is executed.
For example:
Pega Application
|
+—- Case Processing
+—- Rule Execution
+—- Data Access
+—- Integrations
+—- Background Processing
|
v
Runtime Node
The same application can therefore run on multiple nodes.
How a User Request Reaches a Node
For a browser-based interaction, the processing flow can be simplified as:
Browser
|
v
Load Balancer
|
v
Pega Node
|
+–> Authentication
|
+–> Application Context
|
+–> Rule Resolution
|
+–> Business Logic
|
+–> Data Access
|
v
Response
The load balancer determines which node receives the request.
Once the request reaches a node, Pega processes it using the application context associated with the user’s session.
Node Memory
Each Pega node has its own runtime memory.
This means that objects maintained in memory on Node 1 are not automatically the same in-memory objects maintained by Node 2.
Conceptually:
Node 1
+——————–+
| Runtime Memory |
| Rule Information |
| Cached Objects |
| Session State |
+——————–+
Node 2
+——————–+
| Runtime Memory |
| Rule Information |
| Cached Objects |
| Session State |
+——————–+
This distinction becomes important when troubleshooting caching, sessions, and inconsistent behavior across nodes.
Node-Level Caching
Pega uses caching to reduce unnecessary database operations and improve runtime performance.
Because nodes maintain runtime memory independently, cached information can exist separately on different nodes.
For example:
Database
/ \
/ \
Node 1 Node 2
Cache Cache
If relevant application information changes, Pega must ensure that nodes do not indefinitely use outdated information.
This is why cache synchronization and invalidation are important in clustered environments.
Request Processing on a Node
Once a request arrives at a node, several processing stages can occur.
A simplified flow is:
Incoming Request
|
v
Request Handling
|
v
Security / Authentication
|
v
Application Context
|
v
Rule Resolution
|
v
Business Processing
|
v
Data / Integration Operations
|
v
Response
The exact processing path depends on the type of request.
A case interaction, REST request, background job, and queue-processing operation may all use different runtime paths.
Node Types and Specialized Responsibilities
Pega environments can assign different responsibilities to different nodes.
For example, an architecture might separate nodes based on workload:
Pega Cluster
|
+————-+————-+
| | |
v v v
Web Node Background Integration
Node Node
| | |
User Traffic Jobs/Tasks APIs/Services
The exact configuration depends on the Pega version and deployment architecture.
The purpose of specialization is to prevent one workload from unnecessarily affecting another.
For example, intensive background processing could consume CPU resources that would otherwise be available for interactive user requests.
Background Processing
Not all Pega processing occurs as a direct result of a user’s browser request.
Pega also performs background processing.
Examples include:
- Queue processing
- Scheduled activities
- Agent-related processing
- Case escalation processing
- Notifications
- Integration-related asynchronous work
- Other system-maintained background operations
A simplified model is:
User Activity
|
v
Create Background Work
|
v
Queue / Scheduled Work
|
v
Background Processing Node
|
v
Database / External System
This allows the user-facing request to remain responsive while longer-running work is handled asynchronously.
Queue Processing at the Node Level
Queue-based processing is especially useful for distributing asynchronous work.
Consider:
Queue
|
+——–+——–+
| | |
v v v
Node 1 Node 2 Node 3
| | |
+——–+——–+
|
v
Processed Work
Depending on the configuration, multiple nodes can participate in processing available work.
This provides scalability and allows background workloads to be distributed.
Scheduled Processing
Pega environments also perform scheduled processing.
A scheduled task may need to execute periodically rather than as a direct response to a user request.
For example:
Scheduler
|
v
Scheduled Task
|
v
Eligible Node
|
v
Execute Processing
In a multi-node environment, the system must prevent unintended duplicate execution of work that is intended to occur once.
This is one reason node coordination and cluster-aware processing are important.
Node Affinity
Some processing scenarios may have a relationship with a particular node.
For example, certain runtime information may exist in the memory of the node that processed an earlier request.
This can influence how subsequent requests behave if the architecture depends on session affinity or similar mechanisms.
Conceptually:
User
|
v
Load Balancer
|
+—-> Node 1
|
+–> Runtime Session
If subsequent requests are routed elsewhere, the application must still maintain correct behavior through the appropriate session, database, or cluster mechanisms.
Modern distributed architectures therefore need to account carefully for state management.
Stateful vs. Stateless Processing
One of the important architectural questions is whether processing depends on node-local state.
A simplified stateless model is:
Request 1 —> Node 1
Request 2 —> Node 2
Request 3 —> Node 3
Each request can be handled independently.
A state-dependent model can look like:
User
|
+–> Node 1
| |
| +–> State
|
+–> Node 2
|
+–> Different Runtime State
Distributed applications generally need mechanisms to ensure that important application state is not incorrectly dependent on a single node’s memory.
Node Communication
Pega nodes do not operate as completely isolated application servers.
In a clustered environment, nodes need mechanisms to coordinate certain runtime activities.
Examples include:
- Cache synchronization
- Cluster membership
- Background processing coordination
- System-level notifications
- Distributed processing
Conceptually:
Node 1 <——> Node 2
^ ^
| |
+——-> Node 3
This coordination allows the cluster to behave as a distributed application environment rather than a collection of unrelated servers.
Node-Level Performance
Node-level processing is particularly important when investigating performance problems.
Suppose users report slow response times.
The issue may not be caused by the entire application.
It could be isolated to a specific node.
For example:
Load Balancer
|
+—-+—-+—-+
| | |
v v v
Node 1 Node 2 Node 3
| | |
Normal High Normal
CPU
If the load balancer sends a significant portion of traffic to Node 2, users may experience inconsistent performance.
Therefore, performance analysis should consider node-level metrics rather than only application-level metrics.
Common Node-Level Performance Problems
Potential causes include:
High CPU Usage
A node may be processing expensive requests, reports, integrations, or background workloads.
Memory Pressure
Large objects, excessive caching, or high concurrency can increase memory consumption.
Database Bottlenecks
The node may be waiting on database operations rather than consuming CPU.
External Integration Delays
REST, SOAP, database, messaging, or other external calls can cause request threads to remain occupied.
Background Workload
A large amount of asynchronous processing can compete with interactive requests for resources.
Uneven Load Distribution
If traffic is not distributed effectively, one node can become overloaded while others remain underutilized.
Diagnosing Node-Level Issues
When a problem occurs only intermittently, identifying the processing node can be extremely useful.
A troubleshooting approach can be:
Problem Reported
|
v
Identify Time
|
v
Identify Request / Case
|
v
Identify Node
|
v
Check Node Metrics
|
+–> CPU
+–> Memory
+–> Threads
+–> Database
+–> Integrations
+–> Background Processing
This approach can help determine whether the problem is application-wide or node-specific.
Node-Level Logging
Logs can provide valuable information during troubleshooting.
When investigating an issue, correlate:
- Timestamp
- Request
- User
- Case ID
- Node
- Error
- Database operation
- External service call
For example:
10:15:21
User submits case
|
v
Node 2
|
v
Database operation
|
v
Timeout
If similar failures occur only on Node 2, the investigation can focus on that node rather than the entire application.
Node-Level Processing and Database Access
Although nodes have separate runtime memory, they generally rely on shared persistent storage.
A simplified architecture is:
Node 1 —-\
Node 2 —–+—-> Pega Database
Node 3 —-/
This shared database allows nodes to access common application and case data.
However, it also means database performance can affect multiple nodes simultaneously.
For example:
Node 1 \
Node 2 —> Database —> High DB Load
Node 3 /
A database bottleneck can therefore appear as a node-performance problem even when the underlying issue is shared infrastructure.
Node-Level Processing During Deployments
Deployments introduce another important consideration.
Suppose a new application version is deployed into a three-node environment:
Before Deployment
Node 1 -> Version A
Node 2 -> Version A
Node 3 -> Version A
During a rolling deployment, the environment might temporarily look like:
Node 1 -> Version B
Node 2 -> Version A
Node 3 -> Version A
The deployment architecture must ensure that this transition does not create inconsistent or unsupported runtime behavior.
This is why deployment strategies, application compatibility, cache handling, and node coordination are important in distributed Pega environments.
Node-Level Processing and High Availability
Multiple nodes provide resilience.
For example:
Load Balancer
|
+———+———+
| |
v v
Node 1 Node 2
ACTIVE ACTIVE
Node 1 fails
Load Balancer
|
v
Node 2
ACTIVE
The remaining node can continue processing requests, assuming the overall infrastructure and configuration support this behavior.
This reduces the impact of individual node failures.
Node-Level Processing and Scalability
Adding nodes can increase processing capacity.
For example:
1 Node
|
Limited Capacity
|
v
Add Node 2
|
v
Increased Capacity
|
v
Add Node 3
However, simply adding nodes does not automatically solve every performance problem.
If the bottleneck is the database, adding more nodes may actually increase database pressure.
Similarly, if an external API is slow, increasing the number of application nodes may not solve the integration bottleneck.
Therefore, scalability analysis must identify the actual bottleneck.
Common Misconceptions About Pega Nodes
“Every request always goes to the same node.”
Not necessarily. Load balancing and session-management architecture determine request routing.
“All nodes share the same memory.”
No. Each application-server process has its own runtime memory.
“Adding more nodes always improves performance.”
Not necessarily. Shared resources such as databases and external services can become bottlenecks.
“A node only handles user requests.”
No. Depending on configuration, nodes can also participate in background and asynchronous processing.
“If one node has a problem, the entire application must be affected.”
Not necessarily. A multi-node architecture can isolate some node-specific failures.
Best Practices for Node-Level Processing
When designing and supporting Pega environments:
- Understand the responsibility of each node.
- Monitor CPU, memory, threads, and response times at the node level.
- Correlate application problems with the node handling the request.
- Separate heavy workloads when the architecture requires it.
- Monitor background processing independently from interactive traffic.
- Consider database and external-service bottlenecks before adding nodes.
- Design deployments with multi-node behavior in mind.
- Investigate intermittent issues by comparing nodes.
- Understand cache and runtime-state behavior across nodes.
- Use centralized monitoring and logging for distributed environments.
A Practical Example
Imagine a Pega application running on three nodes:
Load Balancer
|
+————+————+
| | |
v v v
Node 1 Node 2 Node 3
| | |
Normal High CPU Normal
| | |
+————+————+
|
Database
Users report that the application is slow only occasionally.
A basic application-level investigation might conclude:
“The application is slow.”
A node-level investigation asks a better question:
“Which node processed the slow request?”
If most slow requests were processed by Node 2, the investigation can focus on Node 2.
Possible causes could include:
- High CPU consumption
- Excessive background processing
- Thread contention
- Memory pressure
- Slow database interactions
- External service delays
- Uneven traffic distribution
This demonstrates why node-level visibility is important for production troubleshooting.
Conclusion
Pega node-level processing is a fundamental concept for understanding how enterprise Pega applications operate in distributed environments.
A node provides the runtime environment in which Pega processes requests, executes rules, interacts with databases, performs asynchronous work, maintains runtime caches, and participates in cluster-level coordination.
The most important architectural concept is:
Multiple Pega nodes provide distributed processing, but each node has its own runtime resources and memory while participating in a shared application environment.
Understanding this distinction helps developers and administrators troubleshoot issues more effectively.
When analyzing a Pega production problem, do not stop at:
“What is the application doing?”
Also ask:
“Which node processed it, what was that node doing at the time, and what shared resource was it waiting for?”
That node-level perspective can make the difference between a generic performance investigation and a precise root-cause analysis.
