
Introduction
Have you ever seen a web application pass every functional test but still perform poorly after release? The checkout page loads slowly, users experience timeouts, and customer complaints start increasing. Although everything works correctly, the overall user experience suffers.
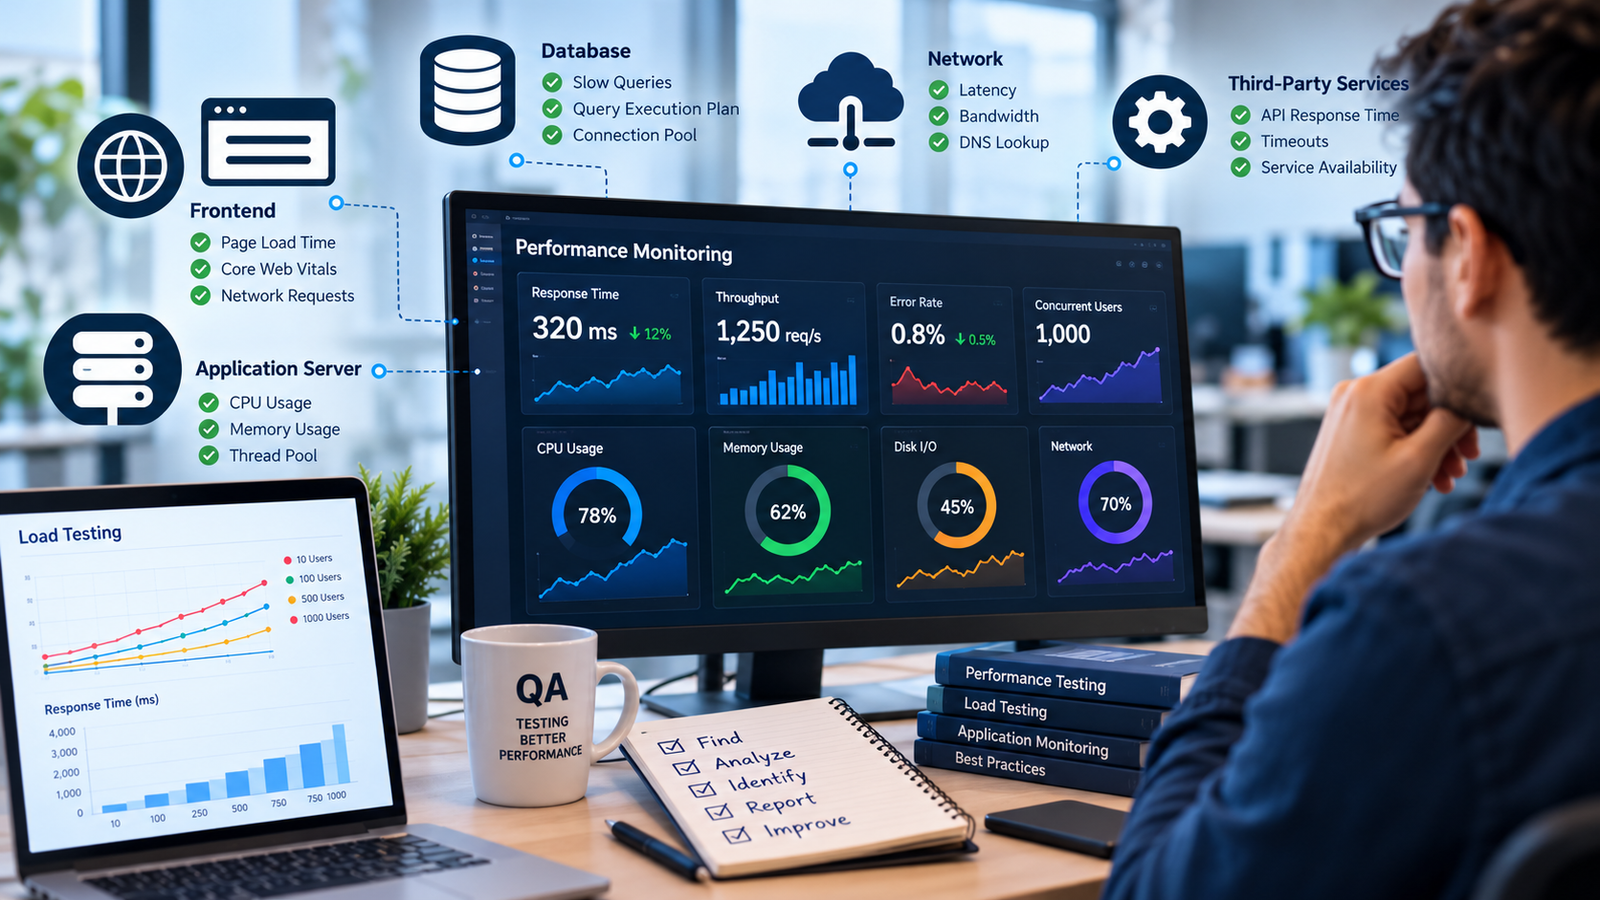
This is where performance bottleneck identification in QA becomes essential. It helps quality assurance (QA) engineers discover why an application is slow, identify the components causing delays, and provide developers with evidence to resolve the problems.
Performance issues can affect customer satisfaction, application reliability, and business revenue. Therefore, testing an application’s functionality is not enough. QA teams must also evaluate how well it performs under different workloads.
In this guide, you will learn how to identify performance bottlenecks, understand important performance metrics, choose the right testing tools, and follow a step-by-step process to improve application performance.
What Is a Performance Bottleneck?
A performance bottleneck is a component or process that limits an application’s speed, capacity, or throughput.
Think of a bottle with a narrow neck. Even if you pour liquid into it quickly, the narrow opening limits how fast the liquid flows out. Similarly, a web application may contain several efficient components, but one slow component can reduce the performance of the entire system.
For example, a website might have a fast frontend and a powerful application server. However, if its database queries take several seconds to execute, users will still experience slow page loads.
Common performance bottlenecks include:
- Slow database queries and missing indexes.
- High CPU utilization.
- Memory leaks and excessive garbage collection.
- Network latency and bandwidth limitations.
- Database connection pool exhaustion.
- Slow third-party APIs.
- Large JavaScript files and unoptimized images.
Identifying the actual cause is important because improving the wrong component may not produce any noticeable performance improvement.
Why Is Performance Bottleneck Identification Important for QA?
Performance testing should not be treated as a final activity performed only before deployment. Instead, QA engineers should evaluate performance throughout the software development lifecycle.
Here are the main reasons why performance bottleneck identification in QA matters.
1. Improves User Experience
Users expect websites and applications to respond quickly. Slow page loads, delayed searches, and checkout failures can frustrate customers.
By identifying performance issues early, QA engineers help teams deliver faster and more reliable applications.
2. Detects Problems Early
Finding a slow API during development is usually easier than investigating the same problem after production deployment.
Early detection gives developers more time to investigate and fix performance issues before they affect customers.
3. Provides Measurable Evidence
Developers need more than a report stating that an application is slow. They need measurable results that explain when the problem occurs and which component might be responsible.
QA engineers can provide response time measurements, error rates, server metrics, logs, and reproducible test scenarios.
4. Supports Application Scalability
An application may work perfectly with 50 users but struggle when 5,000 users access it simultaneously.
Performance testing helps teams understand application limits and determine whether additional resources or code optimizations are necessary.
5. Reduces Production Risks
Performance bottlenecks can contribute to failed transactions, abandoned shopping carts, service interruptions, and lost revenue.
Regular testing helps reduce these risks before a release reaches production.
In short, performance testing complements functional testing by checking not only whether an application works, but also whether it works efficiently under realistic conditions.
Key Performance Metrics Every QA Engineer Should Track
Before identifying performance bottlenecks, QA engineers must understand which metrics to measure.
1. Response Time
Response time measures how long a system takes to complete a request and return the response.
For example, if a login API takes 700 milliseconds to respond, its response time is 700 milliseconds under the tested conditions.
However, averages alone can hide performance problems. Therefore, monitor percentiles such as:
- p50: The median response time.
- p95: The response time at or below which 95% of requests complete.
- p99: The response time at or below which 99% of requests complete.
A high p95 or p99 may indicate that some users experience significantly slower responses than the majority.
2. Throughput
Throughput measures how many requests or transactions a system processes within a specific period.
It is commonly expressed as requests per second (RPS) or transactions per second (TPS).
For example, if throughput stops increasing while additional users are introduced, the application may have reached a capacity limit.
3. Latency
Latency refers to the delay before a request begins receiving a response or before a particular operation starts producing results.
For web requests, time to first byte (TTFB) is a useful measurement of how long it takes for the browser to receive the first byte of a response.
High latency may result from network delays, server processing, or slow dependencies.
4. Error Rate
The error rate represents the percentage of requests that fail.
Common examples include HTTP 500 and 503 responses, connection failures, and request timeouts.
If the error rate increases significantly as the number of concurrent users grows, the application may be approaching its performance limits.
5. Concurrent Users
Concurrent users are users who are active at the same time.
This metric is important because an application that supports thousands of daily visitors may still struggle when many of them perform actions simultaneously.
QA teams should test realistic concurrency levels based on expected usage.
6. Resource Utilization
Resource utilization shows how much of the available system capacity is being consumed.
Important measurements include:
- CPU utilization.
- Memory consumption.
- Disk input/output.
- Network bandwidth.
- Database connections.
- Application thread usage.
When a resource reaches its limit, it can restrict overall application performance.
7. Core Web Vitals
Frontend performance also affects the user experience. Google’s Core Web Vitals provide useful measurements for evaluating loading speed, responsiveness, and visual stability.
The main metrics are:
- Largest Contentful Paint (LCP): Measures how quickly the main content becomes visible.
- Interaction to Next Paint (INP): Measures responsiveness to user interactions.
- Cumulative Layout Shift (CLS): Measures unexpected layout movement.
For a better user experience, Google’s recommended good thresholds are LCP of 2.5 seconds or less, INP of 200 milliseconds or less, and CLS of 0.1 or less, assessed at the 75th percentile of page visits.
Monitoring these metrics helps QA teams identify frontend issues that server-side testing might miss.
Common Types of Performance Bottlenecks
Performance bottlenecks can occur at different layers of a web application. Understanding their common causes helps QA engineers investigate problems more efficiently.
1. Database Bottlenecks
Database bottlenecks occur when queries take too long to execute or the database cannot handle incoming requests efficiently.
Common causes include:
- Missing database indexes.
- Inefficient SQL queries.
- Table locks and contention.
- Excessive database requests.
- The N+1 query problem.
- Poorly designed database schemas.
For example, a product search page may become slower as the product database grows. A query that works well with a small dataset may become inefficient when the table contains millions of records.
How to identify it: Examine slow query logs, query execution plans, database CPU usage, and query execution time.
2. CPU Bottlenecks
A CPU bottleneck occurs when the processor cannot handle the application’s workload efficiently.
High CPU usage combined with flat throughput and increasing response times can indicate that the application has reached a processing limit.
Possible causes include inefficient loops, complex calculations, excessive logging, and poorly optimized regular expressions.
How to identify it: Monitor CPU utilization during load tests and use profiling tools to identify functions that consume excessive processing time.
3. Memory Leaks and Garbage Collection Pauses
A memory leak occurs when an application retains memory that it no longer needs.
As a result, memory consumption may continue to increase during prolonged execution. Eventually, the application may slow down or crash.
In Java and C#, frequent garbage collection pauses can also contribute to response time spikes.
How to identify it: Run soak tests, monitor memory consumption over time, and inspect memory profiles and garbage collection logs.
A soak test is particularly useful because some memory problems appear only after an application has been running under sustained load for several hours.
4. Network and Bandwidth Limitations
Network problems can slow down an application even when the server and database perform well.
Common causes include:
- Large request and response payloads.
- Missing compression.
- Too many HTTP requests.
- Slow DNS resolution.
- High network latency.
- Unoptimized images and other static assets.
For example, a page may load quickly on an office network but become noticeably slower on a mobile connection because it downloads large images and JavaScript files.
How to identify it: Use browser developer tools to inspect network requests, payload sizes, loading times, and failed connections.
5. Connection Pool and Thread Pool Exhaustion
Applications often use connection pools to manage database connections efficiently.
However, if the available connections are occupied by existing requests, new requests must wait until a connection becomes available.
For example, an application with a database connection pool of 20 connections may experience delays when many concurrent requests need database access.
Thread pool exhaustion can create similar problems when all available worker threads are busy.
How to identify it: Monitor active connections, connection wait times, pool saturation, thread counts, and request queue lengths.
6. Third-Party Services and API Bottlenecks
Many applications depend on external services, including payment gateways, email providers, analytics platforms, and cloud APIs.
If an external service responds slowly, the application may also respond slowly, especially when requests must wait for that service to complete.
How to identify it: Measure external API response times, inspect distributed traces, and compare application performance with the external dependency enabled and isolated.
Timeouts, caching, asynchronous processing, and circuit breakers may help reduce the impact of slow dependencies, depending on the application’s requirements.
7. Frontend Performance Bottlenecks
Frontend bottlenecks affect how quickly users can see and interact with a page.
Common causes include large JavaScript bundles, unoptimized images, render-blocking CSS, excessive third-party scripts, and expensive browser operations.
A server may return a response quickly, but the page can still feel slow if the browser takes too long to render the content or respond to user interactions.
How to identify it: Use Chrome DevTools, Google Lighthouse, and WebPageTest to investigate page loading, rendering, JavaScript execution, and network activity.
Types of Performance Testing Used to Identify Bottlenecks
Different testing methods reveal different performance problems. Therefore, a comprehensive QA strategy should include more than one type of performance test.
1. Load Testing
Load testing evaluates application performance under an expected workload.
For example, an e-commerce website may be tested with 1,000 concurrent users to determine whether product searches and checkout requests meet the required response time targets.
2. Stress Testing
Stress testing pushes an application beyond its expected operating capacity.
The goal is to identify its breaking point, understand how it fails, and evaluate how well it recovers after excessive demand.
3. Spike Testing
Spike testing evaluates how an application responds to sudden increases or decreases in traffic.
It is useful for scenarios such as flash sales, ticket launches, and sudden traffic increases after a promotional campaign.
4. Soak Testing
Soak testing, also called endurance testing, evaluates application behavior under sustained load over an extended period.
It helps identify memory leaks, resource exhaustion, and gradual performance degradation.
5. Scalability Testing
Scalability testing determines whether an application can handle increasing workloads when additional computing resources are provided.
It helps teams understand whether adding servers, CPU capacity, or memory improves performance as expected.
6. Baseline Testing
Baseline testing establishes a reference point for future performance comparisons.
QA teams record metrics such as response time, throughput, and resource utilization. After a code change or deployment, they repeat the test to identify performance improvements or regressions.
A Step-by-Step Process for Performance Bottleneck Identification in QA
A structured approach helps QA engineers identify the cause of performance problems instead of relying on assumptions.
Step 1: Define Clear Performance Goals
Start by defining measurable performance requirements.
For example:
- The login API should achieve a p95 response time of 500 milliseconds or less.
- The application should support 1,000 concurrent users.
- The error rate should remain below 1%.
- The checkout process should complete within the agreed performance target.
These are illustrative targets, not universal standards. Actual thresholds should reflect business requirements, user expectations, and the application’s architecture.
Without clear targets, it is difficult to determine whether a test result is acceptable.
Step 2: Use a Production-Like Test Environment
A test environment should resemble production as closely as practical.
Consider the following factors:
- Server specifications.
- Database size and data distribution.
- Network configuration.
- Application configuration.
- Caching behavior.
- External service dependencies.
A small test database may hide query performance problems that appear when production contains millions of records.
Therefore, realistic test data is essential for obtaining useful results.
Step 3: Establish a Performance Baseline
Before increasing the workload, run an initial test and record the application’s performance.
Measure response times, throughput, error rates, CPU usage, memory consumption, and database activity.
This baseline provides a reference for later tests. It also helps determine whether a code change improves or degrades performance.
Step 4: Design Realistic Test Scenarios
Create test scenarios that reflect actual user journeys.
For an e-commerce application, these might include:
- Opening the home page.
- Browsing product categories.
- Searching for a product.
- Viewing product details.
- Adding an item to the cart.
- Proceeding to checkout.
- Completing a payment through a test environment.
Include realistic pauses between user actions and a suitable mix of transactions.
Testing only one endpoint repeatedly may help isolate a component, but it does not necessarily represent the behavior of the complete application.
Step 5: Increase the Load Gradually
Begin with a small number of virtual users and increase the load in controlled stages.
At each stage, monitor response times, throughput, error rates, and resource utilization.
Look for warning signs such as:
- Response times increasing sharply.
- Throughput no longer increasing.
- Error rates rising.
- CPU or memory approaching capacity.
- Database connections becoming exhausted.
Record the load level at which performance begins to deteriorate.
This information helps narrow down the application’s capacity limits.
Step 6: Monitor the Entire Application Stack
Performance problems do not always originate in the component where users notice them.
For this reason, monitor the frontend, application server, database, network, and external dependencies together.
Use application performance monitoring tools and distributed tracing where available. These tools can help you follow a request across multiple services and determine where time is being spent.
Correlating load test results with system metrics provides a clearer picture of the underlying problem.
Step 7: Isolate the Root Cause
Once you identify a potential bottleneck, test your hypothesis.
For example, if database activity appears responsible for slow API responses, compare query execution times and inspect the execution plan.
If an external API seems slow, use a controlled mock or stub to compare application behavior without the external dependency.
Change one variable at a time whenever practical. This makes it easier to determine whether a particular change actually improves performance.
Remember that correlation alone does not prove causation. Confirm the suspected bottleneck with repeatable measurements.
Step 8: Report Findings With Evidence
A useful performance bug report should contain enough information for developers to reproduce and investigate the issue.
Include:
- A clear issue summary.
- The affected endpoint or user journey.
- Test environment details.
- Build or application version.
- Number of concurrent users.
- Test duration and workload pattern.
- Expected and observed performance.
- Response time percentiles.
- Throughput and error rate.
- Relevant CPU, memory, and database metrics.
- Logs, screenshots, or performance graphs.
- The suspected root cause, clearly marked as confirmed or unconfirmed.
For example, instead of reporting that the product search page is slow, state that its p95 response time increased from 400 milliseconds to 4 seconds when the workload reached 500 concurrent users.
This gives developers measurable evidence to investigate.
Step 9: Retest After the Fix
After developers implement a fix, repeat the same test under comparable conditions.
Compare the new results with the original baseline and performance targets.
Check whether response times improved, throughput increased, and error rates decreased.
Also verify that the change did not introduce functional defects or create a bottleneck elsewhere.
In many cases, resolving one bottleneck reveals another. Therefore, performance testing should continue until the application meets its agreed requirements.
Popular Tools for Performance Bottleneck Identification
QA engineers can choose from several tools depending on the application architecture, testing requirements, and available budget.
| Testing Purpose | Common Tools |
|---|---|
| Load and stress testing | Apache JMeter, k6, Gatling, Locust, LoadRunner |
| Application performance monitoring | New Relic, Datadog, Dynatrace, AppDynamics |
| Metrics and dashboards | Prometheus, Grafana |
| Frontend performance analysis | Google Lighthouse, WebPageTest, Chrome DevTools |
| Database analysis | Slow query logs, EXPLAIN plans, pgAdmin, MySQL Workbench |
| Application profiling | JProfiler, VisualVM, py-spy, dotTrace |
Which Performance Testing Tool Should You Choose?
Apache JMeter: Suitable for testing APIs, web applications, and other supported protocols. It is a useful option for teams looking for an established testing tool.
k6: Useful for scriptable load tests and automated performance checks within CI/CD pipelines.
Gatling: Suitable for teams that want code-based performance test scenarios and detailed load test reports.
Locust: Allows testers to write load test scenarios in Python, making it useful for teams familiar with Python.
Google Lighthouse: Helps evaluate frontend performance, accessibility, SEO, and other aspects of page quality.
Prometheus and Grafana: Help teams collect, visualize, and monitor application and infrastructure metrics.
Chrome DevTools: Useful for investigating network delays, JavaScript execution, rendering issues, and browser performance.
You do not need every tool on this list. Start with a load testing tool and the monitoring tools that fit your application.
For example, a team testing a Java web application might combine JMeter, VisualVM, database query analysis, and infrastructure monitoring.
Best Practices for QA Teams
Following consistent practices makes performance testing more reliable and repeatable.
Test Early and Regularly
Run performance checks during development instead of waiting until the final release.
Integrate suitable performance tests into CI/CD pipelines to detect regressions early.
Analyze Percentiles Instead of Only Averages
Average response times can hide slow requests.
Track p95 and p99 alongside averages to understand the experience of users who encounter the longest delays.
Use Realistic Test Data
Small or empty databases may produce misleading results.
Use representative data volumes and distributions whenever possible.
Account for Warm-Up Effects
Caching and just-in-time compilation can affect performance during the first minutes of a test.
Identify the warm-up period and analyze steady-state results separately.
Separate the Load Generator From the Application
Whenever possible, run load generation on a separate machine or environment.
Otherwise, the load generator may compete with the application for CPU and memory, distorting the results.
Document Every Test Run
Record the application version, environment, configuration, workload, and results.
Consistent documentation makes comparisons easier and helps teams reproduce performance issues.
Collaborate With Developers and DevOps
Performance bottlenecks often involve multiple system components.
QA engineers, developers, and DevOps teams should share metrics, logs, and test findings to investigate problems efficiently.
Common Mistakes to Avoid During Performance Testing
Even well-planned tests can produce misleading results if important details are overlooked.
Avoid these common mistakes:
1. Testing only simple user journeys: Complex operations, such as searches, reports, and checkout processes, may reveal problems that basic page loads do not.
2. Trusting a single test run: Repeat tests under comparable conditions to confirm that the results are consistent.
3. Fixing the first slow component: A slow component is not necessarily the primary bottleneck. Investigate its impact before recommending a change.
4. Ignoring frontend performance: Fast server responses do not guarantee that a page will render quickly or respond smoothly to user interactions.
5. Skipping performance targets: Define acceptable response times, error rates, and capacity requirements before testing.
6. Using unrealistic test environments: Differences in hardware, configuration, and data volume can lead to incorrect conclusions.
7. Ignoring external dependencies: Third-party services can affect application response times even when internal components are healthy.
Avoiding these mistakes helps QA teams produce more accurate findings and better performance reports.
Real-World Example: Identifying a Database Bottleneck
Consider an e-commerce website experiencing slow product searches during a promotional sale.
During a load test with 500 concurrent users, the QA engineer observes that the product search page takes approximately eight seconds to respond.
The investigation begins with application and infrastructure monitoring.
Step 1: Analyze Server Performance
The web server’s CPU utilization remains around 30%.
This suggests that the web server’s CPU is unlikely to be the primary bottleneck, although further investigation is still necessary.
Step 2: Check Database Metrics
The database CPU utilization reaches approximately 95%.
This indicates that database processing may be limiting the application’s performance.
Step 3: Investigate Slow Queries
The QA engineer reviews the slow query log and discovers that a product search query scans the entire product table for each request.
The relevant column does not have an appropriate index.
As a result, the database performs unnecessary work while handling concurrent searches.
Step 4: Verify the Fix
The developer adds an appropriate index, and the QA engineer repeats the same load test under comparable conditions.
In this illustrative scenario, product search response time falls below one second, and throughput increases.
Further testing then reveals a smaller database connection pool limitation, which the team addresses separately.
This example demonstrates why performance bottleneck identification in QA should rely on measurable evidence rather than assumptions.
By examining server metrics, database activity, and repeatable test results, the QA engineer helps the team identify the underlying problem and verify the improvement.
Final Thoughts
Performance bottleneck identification is an essential part of software quality assurance. An application may pass every functional test and still deliver a poor user experience when response times increase, resources become exhausted, or external services slow down.
QA engineers can help prevent these problems by defining clear performance goals, designing realistic test scenarios, monitoring the entire application stack, and reporting findings with measurable evidence.
Tools such as JMeter, k6, Chrome DevTools, and application monitoring platforms make this process more manageable. However, the most important skills are knowing what to measure, how to isolate a problem, and how to confirm that a fix works.
Start with your application’s most important user journey. Establish a performance baseline, run a controlled load test, and investigate the first significant deviation from your targets.
With a consistent testing process, QA teams can help deliver applications that are not only functionally correct but also fast, stable, and reliable.
